技术
macOS 环境下内存泄露检测
前言
最近在开发一个 C 的分析库,发现在调用过程中出现内存占用随着请求不断增加的情况,基本可以断定代码存在内存泄露的情况,随后便开始了排查之路。
工具选择
在 C/C++ 开发中比较常用的内存检查工具是 Valgrind,但是由于支持 macOS 的版本 valgrind-macos 暂未支持 aarch64 处理器架构(Apple Silicon),只能寻找另外的分析工具。经过一番搜索,发现 macOS 在安装 Xcode ToolChain 之后,自带了一个内存检查工具 Leaks,便开始进行排查。
项目编译
需要注意的是,为了得到更详细的调试信息,尽量使用 Debug 构建,禁用编译器优化等功能。
# 示例配置,根据构建工具和编译器的不同按需配置
cmake_minimum_required(VERSION 3.10 FATAL_ERROR)

SET(CMAKE_C_FLAGS "${CMAKE_C_FLAGS} -fPIC -Wall -O0 -ggdb")
Leaks
Leaks 识别无指针指向的缓冲区内存,这类内存区域由于指针丢失,无法通过调用用 free() 来释放。从而发现内存泄露的情况。
Leaks 命令 man:
leaks: Search through a process for leaked memory.

Usage: leaks [options] pid | partial-process-name | memory-graph-file
       leaks [options] --atExit -- <command-and-arguments>

        -e/--exclude <sym>     exclude leaked blocks whose backtraces include the specified symbol
        -h/--help              show this helpful usage message!
        -q/--quiet             suppress the process description header and footer
        --list                 print the leaks as a list ("classic"-style) rather than as a tree
        --groupByType          in leak trees, group children by type rather than showing individual instances
                                  (for normal leak detection output, and --referenceTree, --dominatorTree, and --autoreleasePools modes)
        --nostacks             do not print backtraces or save them in the memory graph file, even when available
        --fullStacks           print backtraces with one line per frame
        --nosources            do not show sourceFile:lineNumber in backtraces
        --outputGraph=<path>   save a memory graph file into the given directory or file
        --fullContent          print or save full allocation content descriptions
                                  (this is the default for printing output for live processes)
        --readonlyContent      print or save just readonly allocation content descriptions
                                  (this is the default for saving memory graphs)
        --noContent            do not save or print any allocation content descriptions
        --hex                  show the hex content of leaked allocations, if there is no description of content
        --forkCorpse           generate a corpse fork from process and run leaks on it
        --diffFrom=<memgraph>  show only the new leaks since the specified memgraph
        --trace=<address>      print chains of references from process 'roots' (e.g., global data) to the given block
        --traceTree=<address>  print a reverse tree of references, from the given block up to the process roots
        --referenceTree        print a reference tree of allocated memory starting at root nodes
        --autoreleasePools     print contents of autorelease pools, by thread
        --debug=[mode]         enable additional debugging modes; list available modes with --debug=help
        --atExit               launch the specified command and run leaks when that process exits.
                                  This should be the last argument; use '--atExit -- <command-and-arguments>'
泄露排查
1. 启动程序
MallocStackLogging=1 <command-and-arguments> # 启动需要排查的程序

# OR

leaks [options] --atExit -- <command-and-arguments> # 使用 leaks 直接启动需要排查的程序
2. 内存采样
如果不使用 leaks 直接启动程序,需要使用以下命令对内存情况进行收集,执行命令后,会有一个 <graph-name>.memgraph 文件生成到工作路径。
leaks --outputGraph=<graph-name> <pid|process-name>
3. 结果分析
命令行
leaks <graph-name>.memgraph # 分析单个 memgraph

leaks <graph-name-2>.memgraph --diffFrom=<graph-name-1>.memgraph # 对比两个 memgraph
# 进程环境信息
Process:         <ProcessName> [84122]
Path:            /Users/USER/Documents/*/<Executable>
Load Address:    0x1028c0000
Identifier:      <ProcessIdentifier>
Version:         0
Code Type:       ARM64
Platform:        macOS
Parent Process:  zsh [99192]

Date/Time:       2023-09-06 15:12:41.970 +0800
Launch Time:     2023-09-06 15:11:50.505 +0800
OS Version:      macOS 13.5.1 (22G90)
Report Version:  7
Analysis Tool:   /Applications/Xcode.app/Contents/Developer/usr/bin/leaks
Analysis Tool Version:  Xcode 14.3.1 (14E300c)

Physical footprint:         41.7M
Physical footprint (peak):  41.7M
Idle exit:                  untracked
----

# 统计信息
leaks Report Version: 4.0, multi-line stacks
Process 84122: 70099 nodes malloced for 5131 KB
Process 84122: 313 leaks for 24896 total leaked bytes.

# 堆栈信息
STACK OF 155 INSTANCES OF 'ROOT LEAK: <malloc in <malloc_call_function>>':
12  <ModuleName>              0x10292fb4c runtime.asmcgocall.abi0 + 124
11  <ModuleName>              0x1037ab2fc _cgo_86e3bac9422a_Cfunc_<FuncName> + 52
10  <ModuleName>              0x105abf6b8 <FuncName> + 32   <SourceFile>:48
9   <ModuleName>              0x105abcb44 <FuncName> + 660  <SourceFile>:110
8   <ModuleName>              0x105aa6560 <FuncName> + 88   <SourceFile>:112
7   <ModuleName>              0x105aa6124 <FuncName> + 168  <SourceFile>:101
6   <ModuleName>              0x1056bc75c <FuncName> + 384  <SourceFile>:35
5   <ModuleName>              0x1056c6b08 <FuncName> + 108  <SourceFile>:221
4   <ModuleName>              0x1056c6998 <FuncName> + 344  <SourceFile>:193
3   <ModuleName>              0x1056bf3a8 <FuncName> + 1040 <SourceFile>:567
2   <ModuleName>              0x1056bef80 <FuncName> + 108  <SourceFile>:507
1   <ModuleName>              0x1056beb94 <FuncName> + 3656 <SourceFile>:445
0   libsystem_malloc.dylib    0x19a4b0e10 _malloc_zone_malloc_instrumented_or_legacy + 264
====
    # 泄露内存列表
    155 (19.3K) << TOTAL >>
      1 (128 bytes) ROOT LEAK: <malloc in <malloc_call_function> 0x600000000180> [128]
      1 (128 bytes) ROOT LEAK: <malloc in <malloc_call_function> 0x600000002680> [128]
      1 (128 bytes) ROOT LEAK: <malloc in <malloc_call_function> 0x600000002700> [128]
      1 (128 bytes) ROOT LEAK: <malloc in <malloc_call_function> 0x600000002780> [128]
      1 (128 bytes) ROOT LEAK: <malloc in <malloc_call_function> 0x600000002800> [128]
      1 (128 bytes) ROOT LEAK: <malloc in <malloc_call_function> 0x600000002880> [128]
......

# 二进制信息
Binary Images:
......
Xcode
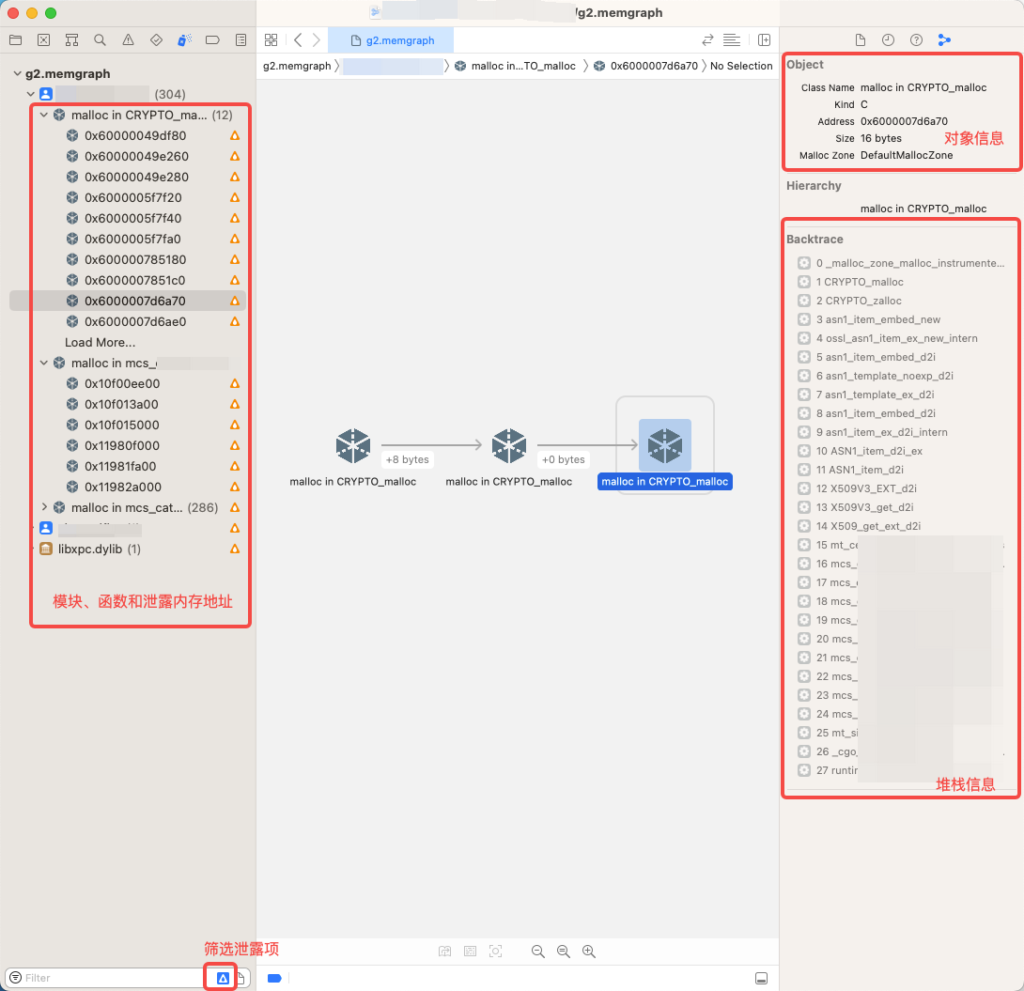
Xcode 可以直接打开对应的 memgraph 文件
修复
借助 leaks 给出的信息排查相应的代码块,释放未释放的内存,解决内存泄露的问题。